
A couple weeks ago, I spoke with the Internet Director for a huge dealer group whose website/SEM provider had told him NOT TO BUY his dealership name on Google. I was stunned. Continue Reading

A couple weeks ago, I spoke with the Internet Director for a huge dealer group whose website/SEM provider had told him NOT TO BUY his dealership name on Google. I was stunned. Continue Reading

You might have missed it, but in late September, Google announced a potentially revolutionary new Adwords marketing channel that they’ve named Customer Match. Google is giving dealers the ability to sell and service more cars by getting more value out of an asset they already own – their existing customer lists. Continue Reading
On September 1, 2015, Google announced that they would begin flagging sites as “Not Mobile Friendly” in the Google Search Console if they were using a Mobile App Interstitial that “hides a significant amount of content and prompts the user to install an app”. Google is doing so because their “analysis shows that it is not a good search experience and can be frustrating for users because they are expecting to see the content of the web page.”
I didn’t think much about the announcement at the time, because I had never seen one of DealerOn’s websites use a “Download Our App” message. Early last week, I happened to come across a dealership’s group website (not one of our customer’s) that DID have this problem. I’ve obscured the dealership’s name, which otherwise would appear at the top of the screen. Here is what the site looked like on my phone:
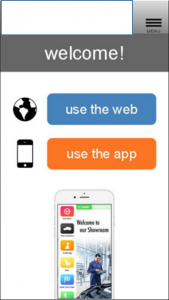
I noticed that the site did not show as “Mobile Friendly” in Google’s search results, so I went to the Google Mobile-friendly testing tool (https://www.google.com/webmasters/tools/mobile-friendly/) to try and find out why. When I put the URL into the Google Mobile Friendly testing tool, this was the answer I got back from Google:
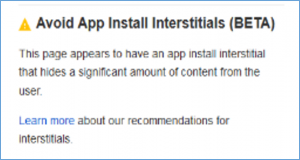
It appears that Google is now classifying websites as “not mobile friendly” if they have App Download Interstitials that cover up content from the dealer’s site.
Make sure that if you’re promoting your App on your dealership website, and encouraging your customers to download the App straight from your site, that you have run your website through Google’s Mobile-Friendly testing tool to make sure you haven’t inadvertently damaged its “mobile friendliness” with Google.
Google Search Console
About three days after I saw this, I was reminded of another important lesson from Google that I want to pass along to dealers and their vendors. It turns out that one of our clients WAS using an App very similar to the one that I just showed above. We received this email from the Google Search Console (formerly Google Webmaster Tools) stating that one of our sites was NOT Mobile-friendly due to “App install interstitials that hide content”.
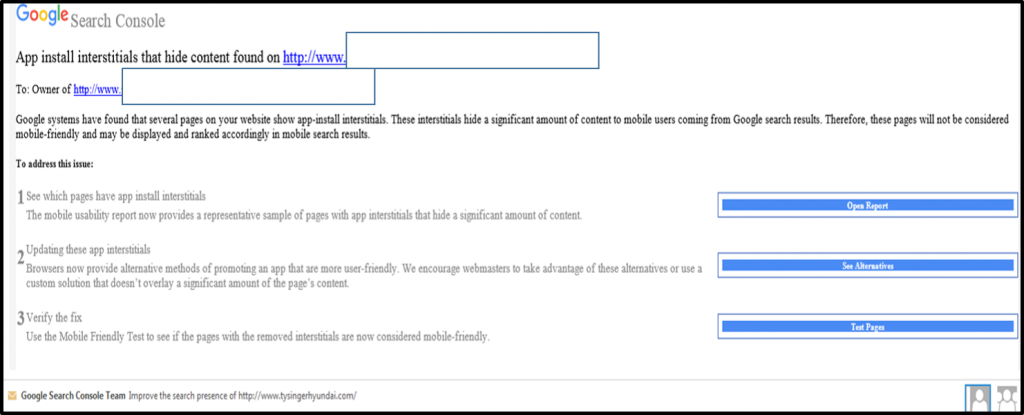
The email that Google Search Console sent was very helpful. It even included a link to the report in Search Console that shows all of the pages on the site that are impacted by the app interstitial.
Most importantly, the notification is PRO-ACTIVE! If your site is impacted by this change Google will actually notify you or your website vendor, provided that you have Webmaster Tools/Search Console properly set up on your site. For years I’ve been telling dealers that they should make sure their website provider is not only setting up their websites in Google Webmaster Tools/Search Console, but that they also pro-actively monitor their website performance using that tool. Google’s recent change makes that more critical than ever. If your website provider has not connected your site with Google’s Search Console and aren’t vigilantly monitoring your site’s health, you may be losing traffic, leads, and money due to a problem that Google is trying to warn you about.
Wrap Up
Make sure that if you have a Mobile App and you advertise it on your website, you check your site in Google’s mobile friendly test panel. Even if you don’t have a mobile app interstitial, you should probably run your site through the mobile friendly test anyway to make sure you don’t have one of the 10-20% of dealer sites that still aren’t mobile friendly. Finally, and perhaps most importantly, make sure that your site is set up on Google Search Console, so if Google ever does flag it for any issues, you get alerted before it costs you any real money.
Almost every month Google provides some new, interesting, beneficial improvement to Google Analytics. In late 2013 Google began providing rich data about the demographics and interests of your website traffic. At DealerOn, we’re always trying to use data to improve the customer experience for our dealers, so I wanted to show you how to use Google Analytics Demographics information so you can learn more about your website visitors and understand how your site is serving them. The first step is to set up the Demographics reporting in Google Analytics.
Setting Up Demographics Data
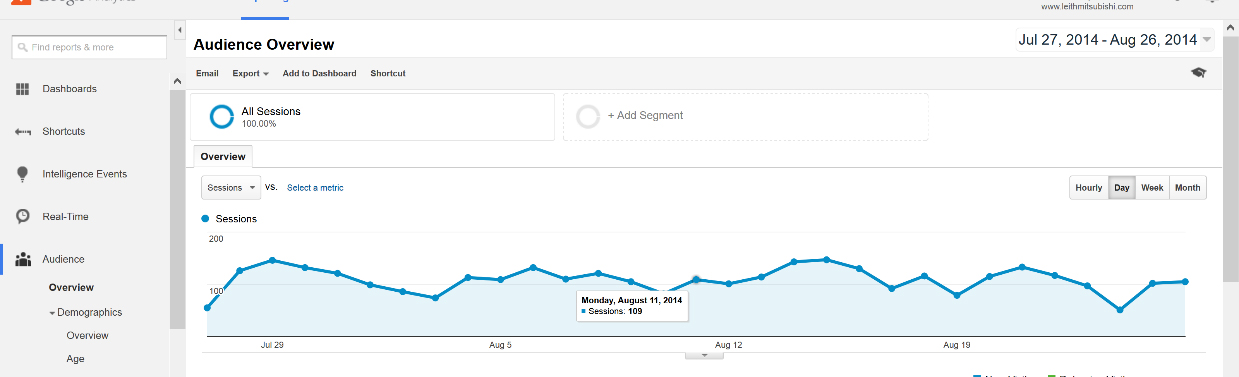
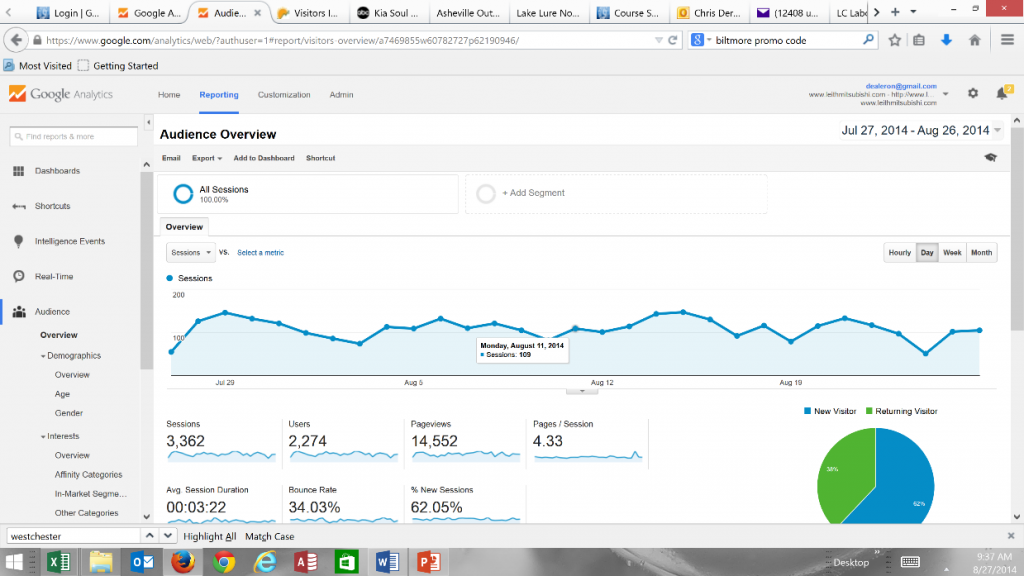
When you log into Google Analytics, you will see a screen like this:
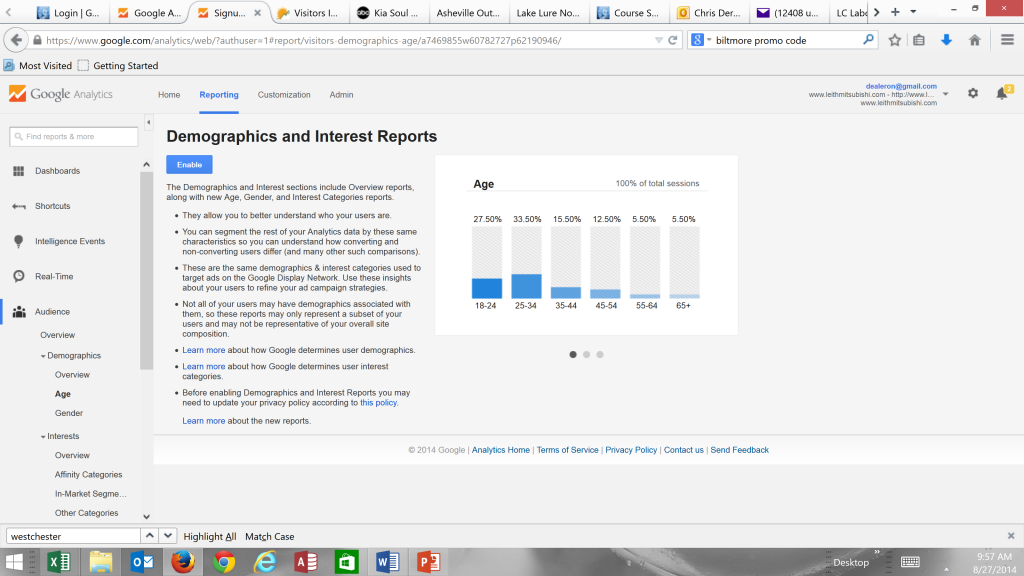
If you click on the text “Age” under the Audience>Demographics section, you will get the screen below. Click on the “Enable” button. You will get a message that says “Congratulations! You have successfully enabled the Demographics Reports. While you can access them now, it may take up to 24 hours before there is data available in these reports.”
In a few days or weeks you will have enough data to start analyzing the demographics of the traffic that is actually coming to your site. You’ll be able to see the:
1) the ages of the traffic coming to your site (18-24, 25-34, 35-44, 45-54, 55-64, 65+),
2) Sex (split of male/female)
3) Interests (Affinity Categories like Movie Lovers, Auto Enthusiasts)
4) In-Market Segments like Autos & Vehicles/Motor Vehicles/Motor Vehicles (Used)
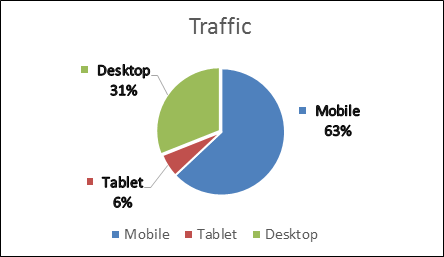
There’s a treasure trove of information that you can take advantage of to improve your own marketing efforts as well as make sure that you’re delivering a great customer website experience. For today, I want to touch on Age and Device (mobile vs. tablet vs. desktop). In the past, my colleagues and I have talked about the importance of mobile and responsive websites, but when you break down demographics for a dealer’s website traffic, the importance of mobile and the younger demographics becomes stark. For one of our highest trafficked sites, here is the breakout of Mobile/Tablet/Desktop for 18-24 year olds:
For ages 25-34 and 35-44, Mobile is still higher than desktop, even without including Tablet traffic. Too many dealers are still assessing their websites based on browsing the site at the dealership on a computer. For many sites (you should check yours), the majority of traffic from your target demographic may not even be seeing that version of your site. If you’re a Kia dealer and your brand is targeting young professionals, then your mobile site experience is paramount to your digital brand. You should check to see whether the advertising that you’re doing is focused on younger demographics and that your site is delivering a good experience for them. We’ll explore other ways of using this demographics and interest information to make better marketing decisions over the next few weeks.
Let me know if you have any topics you’d specifically like us to cover on how to get the most out of your Google Analytics Demographic and Interest data.
We all know that one of the most important traffic sources for the typical car dealer website is Google’s organic search listings. Google has made it very clear that one of the most important factors in determining where your dealership’s website content ranks on Google is the speed at which that page loads for their users. Google has stressed that the page load time is an EVEN bigger factor for mobile rankings than for traditional desktop search results. Did you know that Google Analytics has a Site Speed Page Timings report that shows you the speed for EVERY page on your site in one easy report?
Over the last few weeks, we have written about Google’s site speed insight tool that can show you or your website provider how to lower the load time of a particular page on your site. But how can you get information about which pages you should check? The Google Analytics Site Speed Page Timings report shows you Google’s calculated load time for EVERY page on your site, along with the amount of traffic each page receives, and what the Bounce Rate is for that page!
Page Timings Report:
Here is an example of the Google Analytics Page Timings report. To access the report in your Google Analytics account, just click through on “Behavior>Behavior Flow>Site Speed>Page Timings”. You will get a report that looks like this:
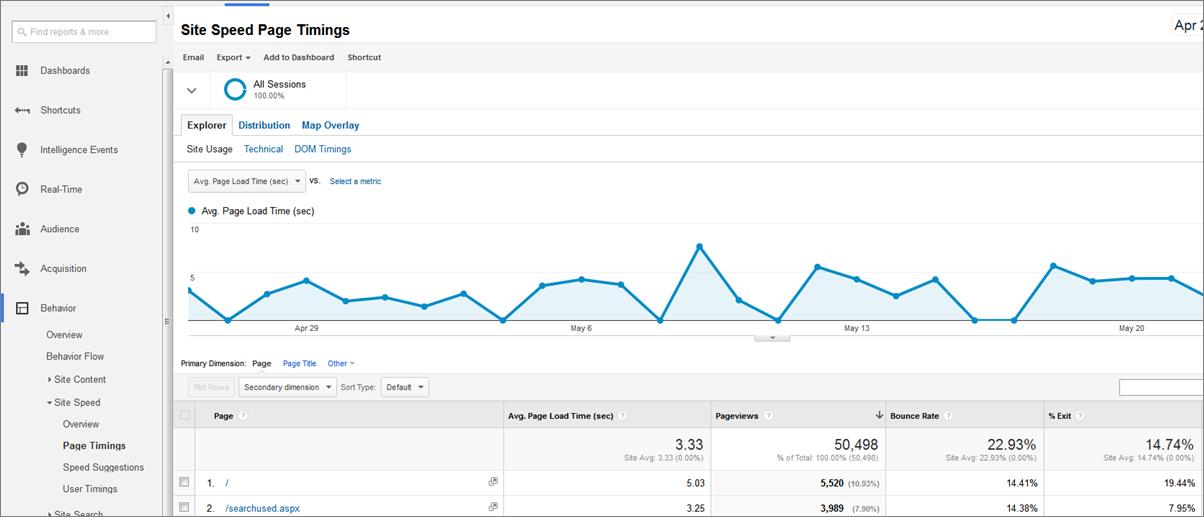
For every page on your site, the report shows:
If you use the sort functionality within the report, you can focus on the pages with the highest Load times, the Most Traffic, or the highest Bounce Rates. You can easily identify the highest trafficked pages on your site that also have high Bounce Rates, and see if the load times for those pages are part of the Bounce Rate problem.
You can even filter this report to just show Organic Search traffic and use “Landing Page” as the Primary Dimension, which will then show you the actual load time for consumers coming to your website from Google or Bing. Because you also have the Page Views, you can easily focus on the pages with High Load Times, High Bounce Rates and High Traffic volumes, helping you to get the most return from your time investment.
Because page speed is an even more critical SEO factor for mobile, this report REALLY becomes valuable if you filter the traffic to show only Mobile Visitors. When you create a report that shows pages that have lots of traffic, high bounce rates, and high load times for Mobile traffic, you can use the Google PageSpeed Insights Tool to get actionable information on how to speed up the pages that will provide the most value to your dealership if you optimize them (because they have the most inbound traffic).
If you are investing a material amount of money in paid search advertising, you should run this same report, filtered on your paid search traffic. You can then isolate any landing pages that are problematic from a Speed/Bounce Rate view. Once you’ve isolated the problem landing pages you could send the traffic to a similar, but faster landing page with a lower bounce rate, invest some time in fixing the current landing page, or pause the campaign until you have time to improve your results.
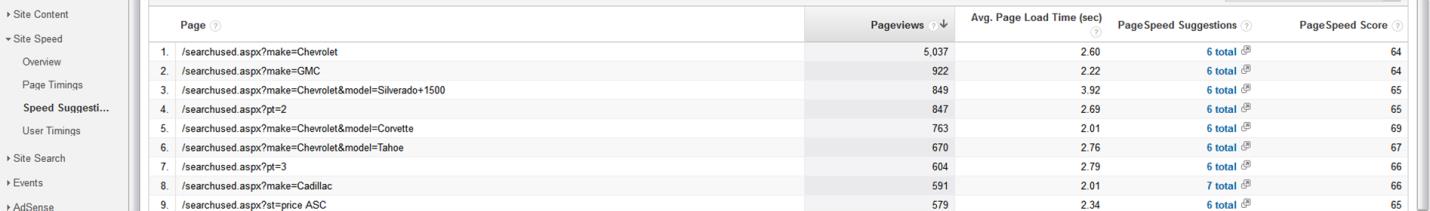
Speed Suggestions Report:
If you just want to see a list of pages with their accompanying Google Page Speed scores, you can click on the “Speed Suggestions” report just below the “Page Timings” report and get a list of all the pages in your site, sorted by Page views, with the accompanying Google Page Speed score (0-100) and a link to the Google Insight suggestions for improving the page speed.
Google is continuously improving Google Analytics to provide insight into how Google evaluates your site’s content for its organic search rankings and paid search traffic. Make sure that you aren’t overlooking this free tool that can help you, your website provider, your SEO guru, or your paid search vendor maximize your dealership’s return on their time and efforts.
Copyright © 2025 DealerOn, Inc.
Privacy Policy
Consent Preferences